Wednesday, April 10, 2013

Proportional Circle Map


Proportional circles are used in these maps to show the amount of a variable, and then to compare it to the size of other circles across a geographic region. The map above from 2000 shows the amount of people killed in road accidents was much less in Sweden and Finland, while Spain, France, and Germany had much higher death rates. 

Flow Map


Flow maps are maps used to show a reallocation of resources. The resource moved can be food, money, people or perhaps immigrants, and even the flow of water in the ocean. The above map shows the flow of smallpox across the globe. Maps like these are useful to examine the flow of a variable across a large geographical area.

Population Profile


Population profile is a tool often used in economics. It shows a great range of age groups and the approximate number of individuals in each group. Typically a population profile looks a bit like a pyramid, where there are a large amount of young people, and a relatively small number of elderly. However, as technoology continues to lengthen the lifespan of the average human, many nations are beginning to have a disproportionate amount of elderly. The above populatin profile is an extrapolation of Japans population in 2050. This merely exaggerates the current problem in Japan, and that is there are too few young people being produced to support the old. In primitive cultures, where vaccinations and clean water are unavailable, the population pyramid shows a much greater number of young people. Below is a population profile of Kenya, which serves as a good example of a third world population.


Climograph


Climographs are common tools in meteorology to show a regions annual precipitation and temperature. The months of the year are listed on the X-axis while temperature and precipitation are on the two Y-axes on either side. It is easy to see in the example climograph that India experiences a slightly warmer season from January until March, and then heavy precipitation begins in June and continues through part of April. During the rainy season the temperature falls slightly, but it is mostly warm year round.

Choropleth Map


Choropleth maps are shaded or proportioned to show a statistic. In the map above, states are shaded based on their popular vote for the 2012 presidential election. Choropleth maps are a quick tool to asses and present a measured variable across a large span of geography. Some choropleth maps have only 2 colors, like the example above, but other choropleth maps may be shaded from dark to light or even distort land figures to present data.

Scatter Plot


Scatter plots are useful diagrams that show the relation of two variables. The explanatory variable, or independent variable, is labeled on the X axis. The Y axis denotes the response, or dependent variable. A good example of data that may be effectively expressed in a scatter plot is a weight vs height plot. Height would be the independent variable, and it makes sense to think that taller people are generally heavier. Therefore height dictates wight to some extent. However, not everyone who is exactly six feet tall is not also exactly 170 pounds. By plotting the intersecting points of our data set, in this example the height and weight of several individuals, we can begin to see a trend in the data.

Tuesday, April 9, 2013

Boxplot


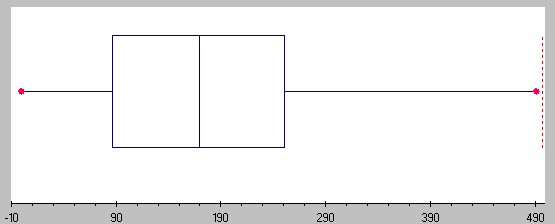
Boxplots are efficient tools to depict a data set's minimum, 25th percentile, median, 75th percentile, and maximum values. The red dots on either end designate the min and max values, minimum on the left, and maximum on the right. The first verticle line on the left is the 25th percentile, while the first verticle line on the right is the 75th percentile. The verticle line in between the 25th and 75th percentiles is obviously the median. Boxplots are very quick and easy to use, and are effective rough visual aids.