Isotachs are lines showing areas of equal wind speed. the map above is showing wind speeds across the united states.
Tuesday, April 16, 2013
Isobars
Index Value Plot
An index plot works like a line graph, except the values represented are indexed. Stock market graphs often show indexed values to compare their growths to previous rates, but still factor in a change in currency inflation.
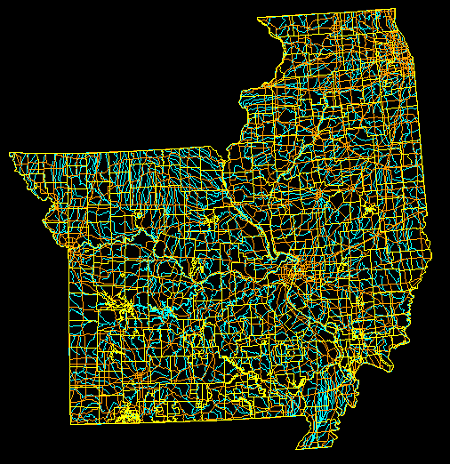
DLG-Digital Line Graph
DOQQ
Unclassed Choropleth Maps
Unclassed choropleth maps are like other choropleth maps, using shades of color to represent data correlation. Instead of having variable ranges split into groups, like a classed choropleth map, there are as many intervals as there are areal spaces.
Continuously Variable Proportional Circle Map
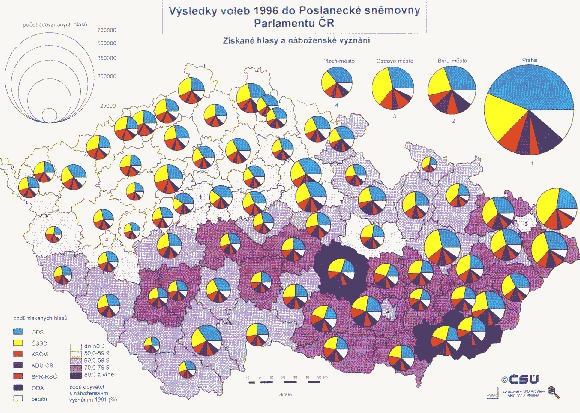
Continuously variable proportional circle maps are useful in the same way regular proportional circle maps are, except that the former can present several different variables. Notice the example map above, the size of the circle indicates a high concentration of all variables, but sizes of the particular sections of each circle also indicate the concentration of the individual variables.
Histograms
Star Plots
Star plots are a way of presenting multivariate data, usually containing five or more variables. The correlation between each attribute is drawn from the center towards the variable label. Stronger correlations reach farther away from the center. Above is a star plot of showing scripts judged and rated poorly. Contestant scripts are shown with different colors. Below is a star plot showing a few highly rated scripts.
Monday, April 15, 2013
Windrose
Parallel Coordinate Graphs
Triangular Plot
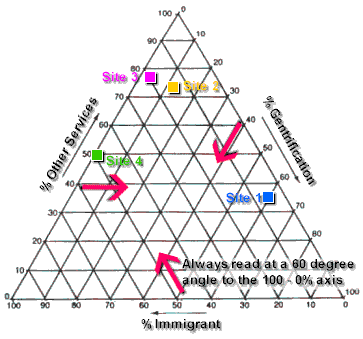
Triangular plots are useful for representing exactly three variables. The points on the plot show specific compositions of the three variables combined. An easy example to think of would be soil type consisting of sand, silt, and clay. Different ratios of each soil type may drastically alter the composition of the final combination.
Accumulative Line Graph
Accumulative line graphs are also known as Lorenz curves, named after Max O Lorenz, who used the model to show wealth inequality. The black straight line is the line of equality, or line of equal wealth distribution. The graph above has wealth separated based on race. Like any Lorenz curve, the graph shows a high percentage of wealth among a few individuals, and a low percentage of wealth among many individuals.
Nominal Area Choropleth Maps
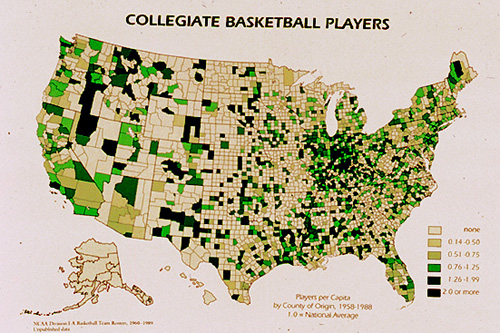
Like other choropleth maps, nominal area choropleth maps use a range of colors or shades to show a range of data values. In a nominal area choropleth map, nominal data is shown, which is pretty explanatory of itself. Above, the choropleth map shows collegiate basketball players with darker areas showing higher numbers of players.
DRG-Digital Raster Graphics
Digital raster graphics are useful tools for locating geographic features. A topographic raster image is georectified to known longitudinal and latitudinal points or features, thus giving an accurate overhead image. The image above is a DRG of the Patomac River and a section of Washington D.C. that surrounds it.
Unstandardized Choropleth Maps
Unstandardized choropleth maps present data in its raw form, without averaging into percentages or decimals. The example map shows unemployment levels in 2008 with raw number values, indicating a higher level of unemployment in the western states as well as in states like Michigan and Ohio.
Standardized Choropleth Maps
When a choropleth map is standardized, its data values have been areally averaged. This presents the data as a rate, percentage, decimal, etc. A single color is used to show the range of, in the example above, Bayesian smoothed prevalences in Lower Saxony.
Sunday, April 14, 2013
Cartographic Animations
Catrographic animations are most recognizable from the fields of meteorology. Cartographic animations simply show a change in a variable over a period of time. This is done by showing images of progressing data, such as a storm moving from an ocean onto a land surface.
Hypsometric Map
Hypsometric maps are used to show altitude. Instead of using contour lines, which is common when dealing with vertical data, altitude is shown with a change in color. In the example map above, the dark colors show the areas of lowest altitude, while the warm colors show higher regions.
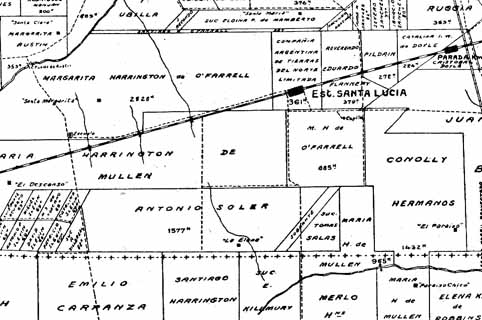
Cadastral Maps
Subscribe to:
Posts (Atom)